An optimally windowed chirp (OWChirp) imposes a tapered, exponentially swept sinusoid (Tutorial 2) and records the transient strain and stress . Because the excitation is broadband, one chirp of a few seconds yields a full frequency spectrum, which makes time-resolved spectroscopy of evolving materials possible (Geri et al., 2018).
OWChirpAnalysis converts each transient wave collected using the TRIOS Arbitrary Wave procedure into the frequency domain:
Trims the signal to the analysis window and removes systematic offsets (motor bias, encoder drift) with the baseline filter that best satisfies
filter_criterion.Zero-pads and Fourier-transforms strain and stress, giving the complex modulus
Derives , and within the chirp band .
Stress-controlled instruments add an inertia correction based on the strain-rate transform; the transform selects it from the instrument metadata.
Data and setup
The file contains a series of OWChirp waves recorded on an ARES-G2 during a temperature sweep. OWChirp time-domain files were downsampled by a factor of 4 (500 Hz to 125 Hz, every 4th point kept) to reduce file size; the full-resolution files are available on request from Alessandro Perego (aperego@mmm.com).
from pathlib import Path

from hermes_rheo import OWChirpAnalysis, TriosRheoReader, read_file
from hermes_rheo.visualization import OWChirpVisualizer, use_science_style

use_science_style()
DATA = Path("tutorial_data")
Read and transform
The reader stores each transient wave as a measurement. After the transform, every measurement holds two datasets:
datasets[0]— frequency-domain , , , and versus ;datasets[1]— the raw time-domain signals together with the baseline-corrected strain and stress.
The chirp parameters and the selected baseline filter are added to the
measurement details.
raw_experiment = read_file(
    DATA / "aresg2_trios_owchirp_tts.txt",
    file_reader=TriosRheoReader,
    create_composite_datasets=True,
)
processed_experiment = OWChirpAnalysis()(raw_experiment)
visualizer = OWChirpVisualizer(processed_experiment)
Inspect representative waves
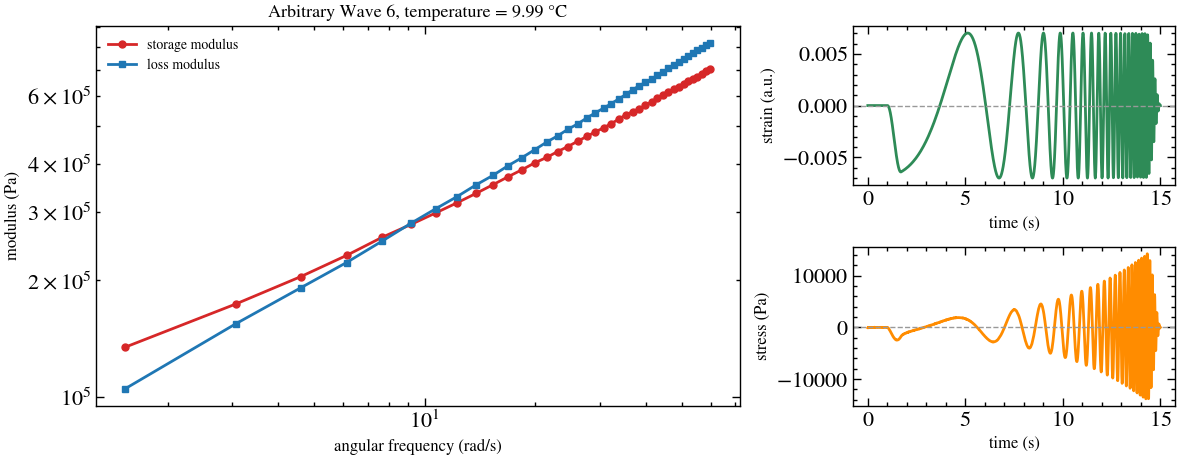
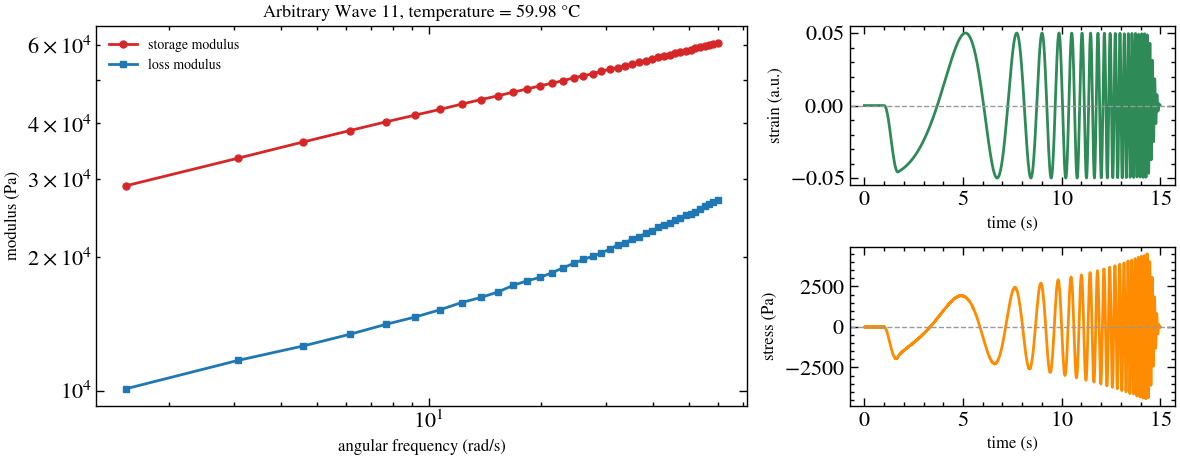
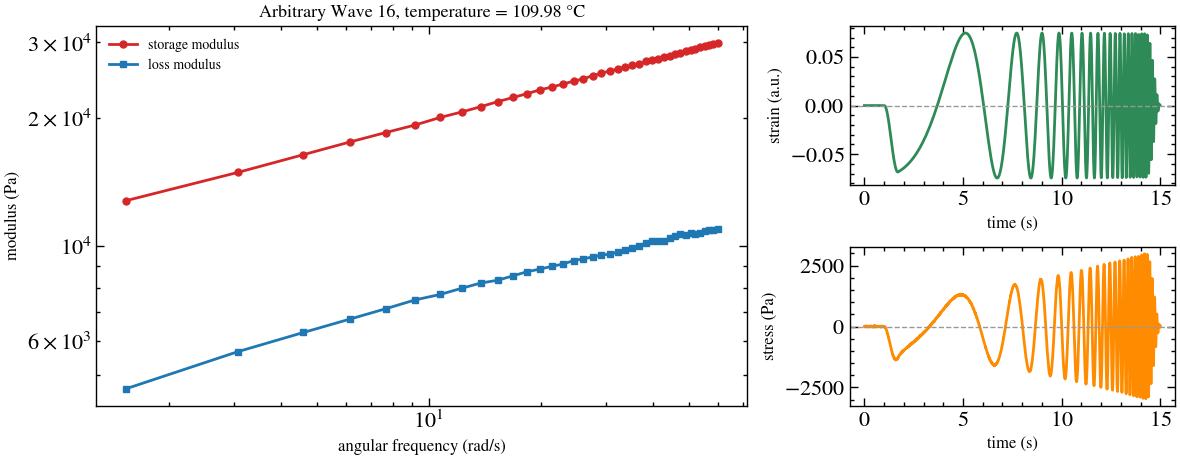
OWChirpVisualizer reads quantities, labels and units from the processed
datasets. Each figure shows the moduli of one wave next to its corrected
strain and stress. steps="first-middle-last" keeps the notebook light; pass
steps="all" or a list of indices to show other waves, and use
visualizer.to_video(path) to animate the full series.
figures, axes = visualizer.plot_waves(steps=[3, 5, 10, 15]) 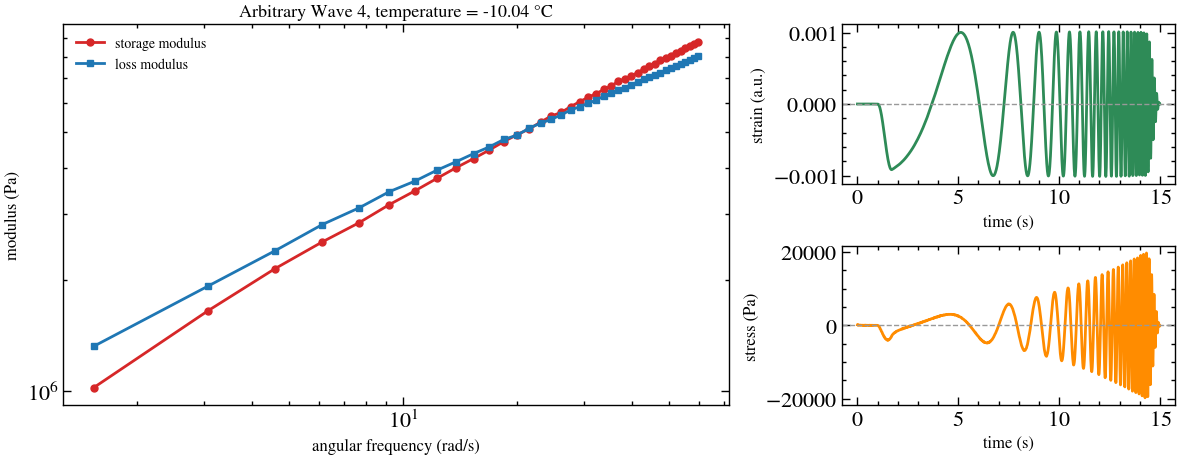
Inspect one Fourier transform
Comparing the time-domain signals with their Fourier amplitudes checks the quality of a wave: the strain spectrum should be flat across and fall off outside it, and the stress spectrum should remain well above the noise floor where the moduli are computed.
figure, axes = visualizer.plot_fourier(step=10)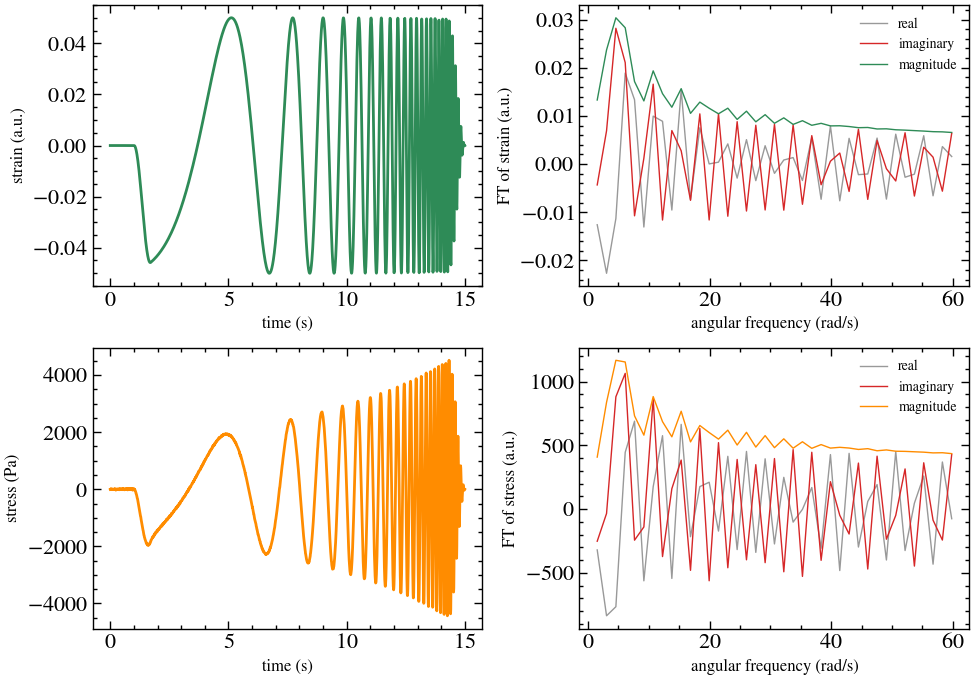
References
Geri, M., Keshavarz, B., Divoux, T., Clasen, C., Curtis, D. J. and McKinley, G. H., Time-Resolved Mechanical Spectroscopy of Soft Materials via Optimally Windowed Chirps, Physical Review X 8, 041042 (2018). DOI: Geri et al. (2018).
Perego, A., Vadillo, D. C., Mills, M. J. L., Das, M. and McKinley, G. H., Evaluation of Optimally Windowed Chirp Signals in Industrial Rheological Measurements: Method Development and Data Processing, Rheologica Acta 64, 391–406 (2025). DOI: Perego et al. (2025).
- Geri, M., Keshavarz, B., Divoux, T., Clasen, C., Curtis, D. J., & McKinley, G. H. (2018). Time-Resolved Mechanical Spectroscopy of Soft Materials via Optimally Windowed Chirps. Physical Review X, 8(4). 10.1103/physrevx.8.041042
- Perego, A., Vadillo, D. C., Mills, M. J. L., Das, M., & McKinley FRS, G. H. (2025). Evaluation of optimally windowed chirp signals in industrial rheological measurements: method development and data processing. Rheologica Acta, 64(8), 391–406. 10.1007/s00397-025-01511-0